
Get In Touch
jamtz.salazar@gmail.com
UI June 18, 2020

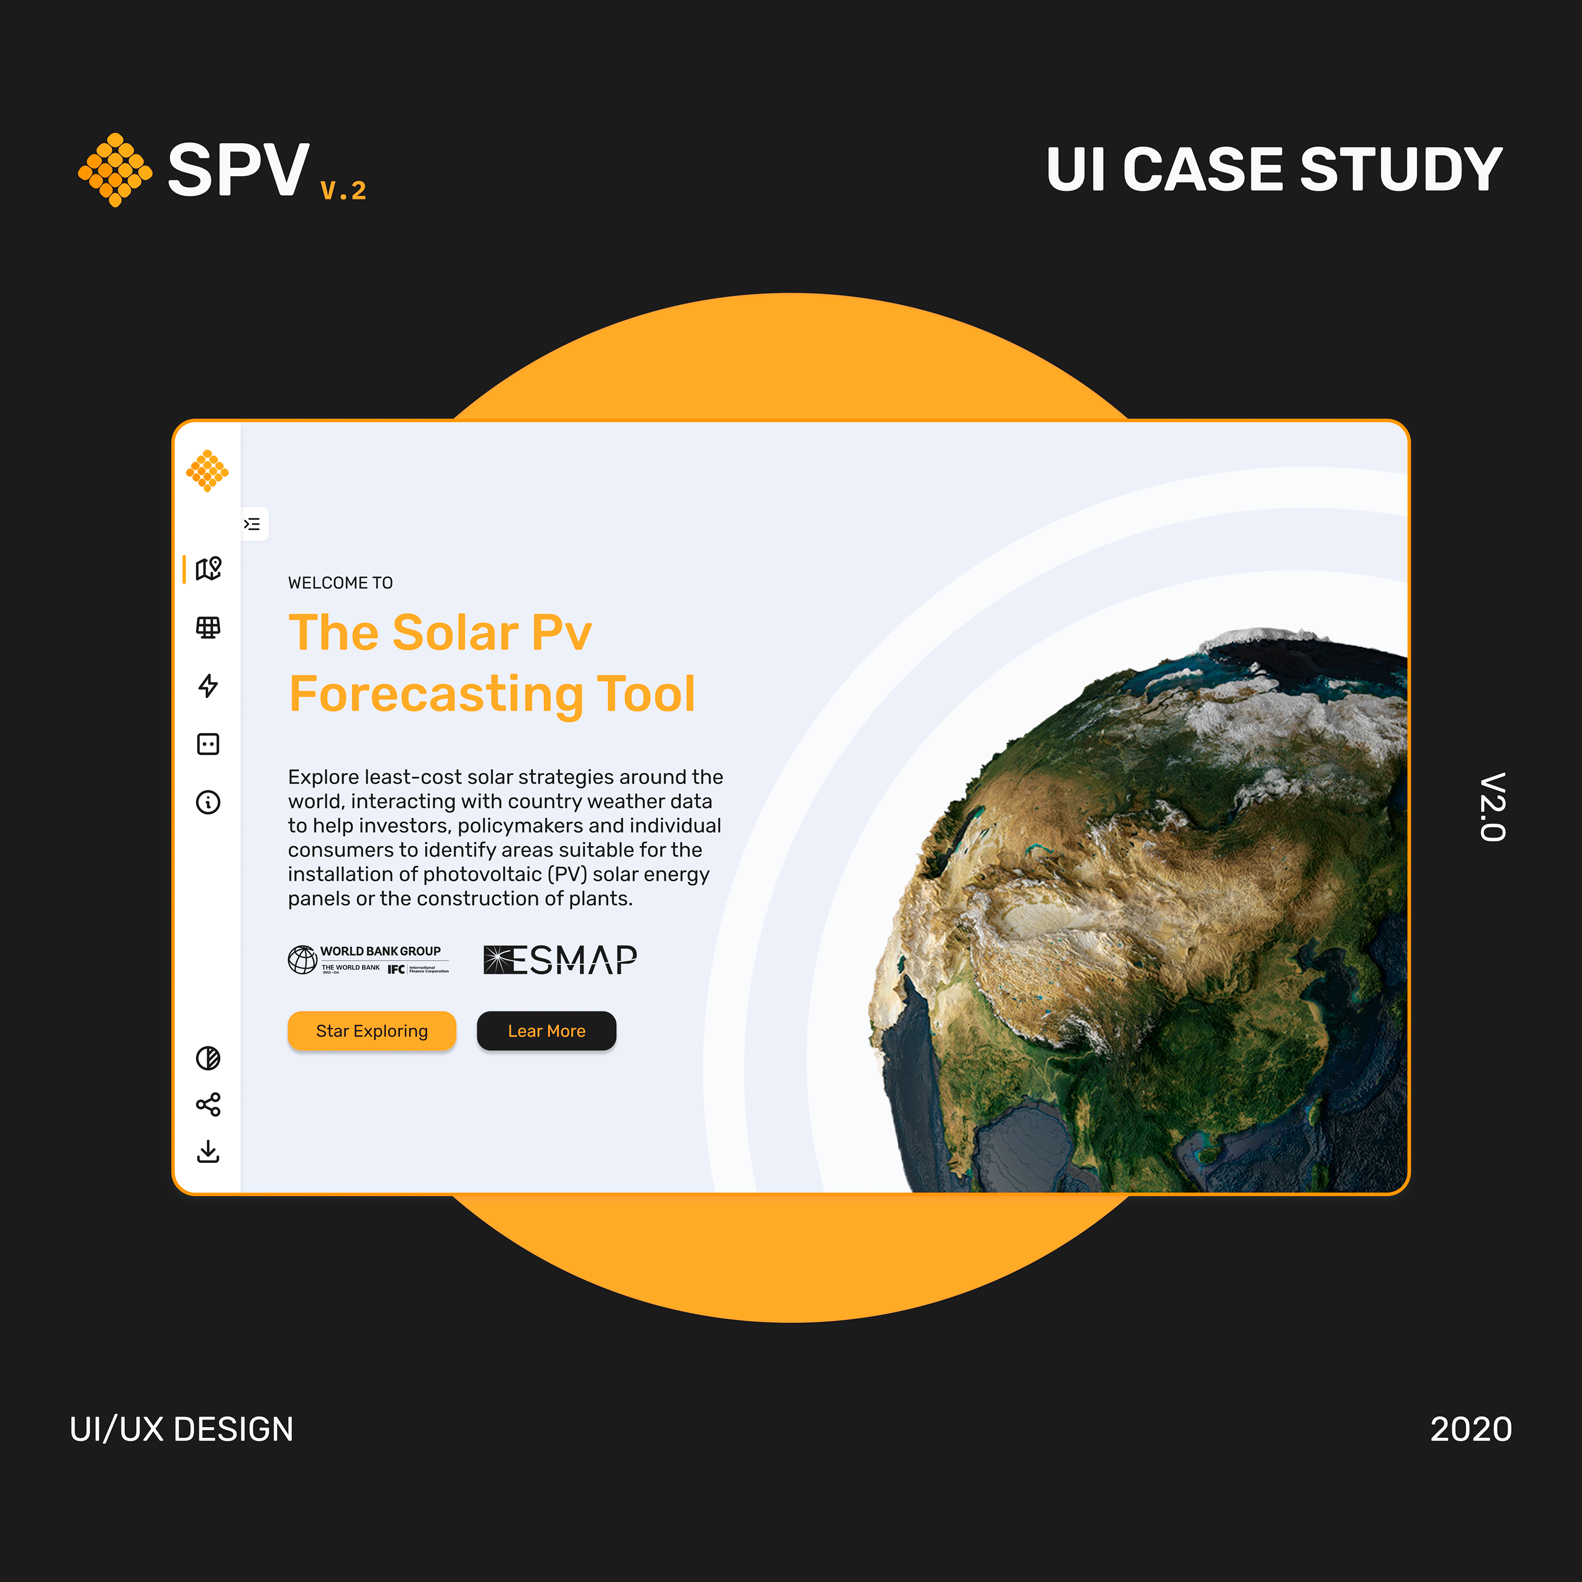
SPV. V2

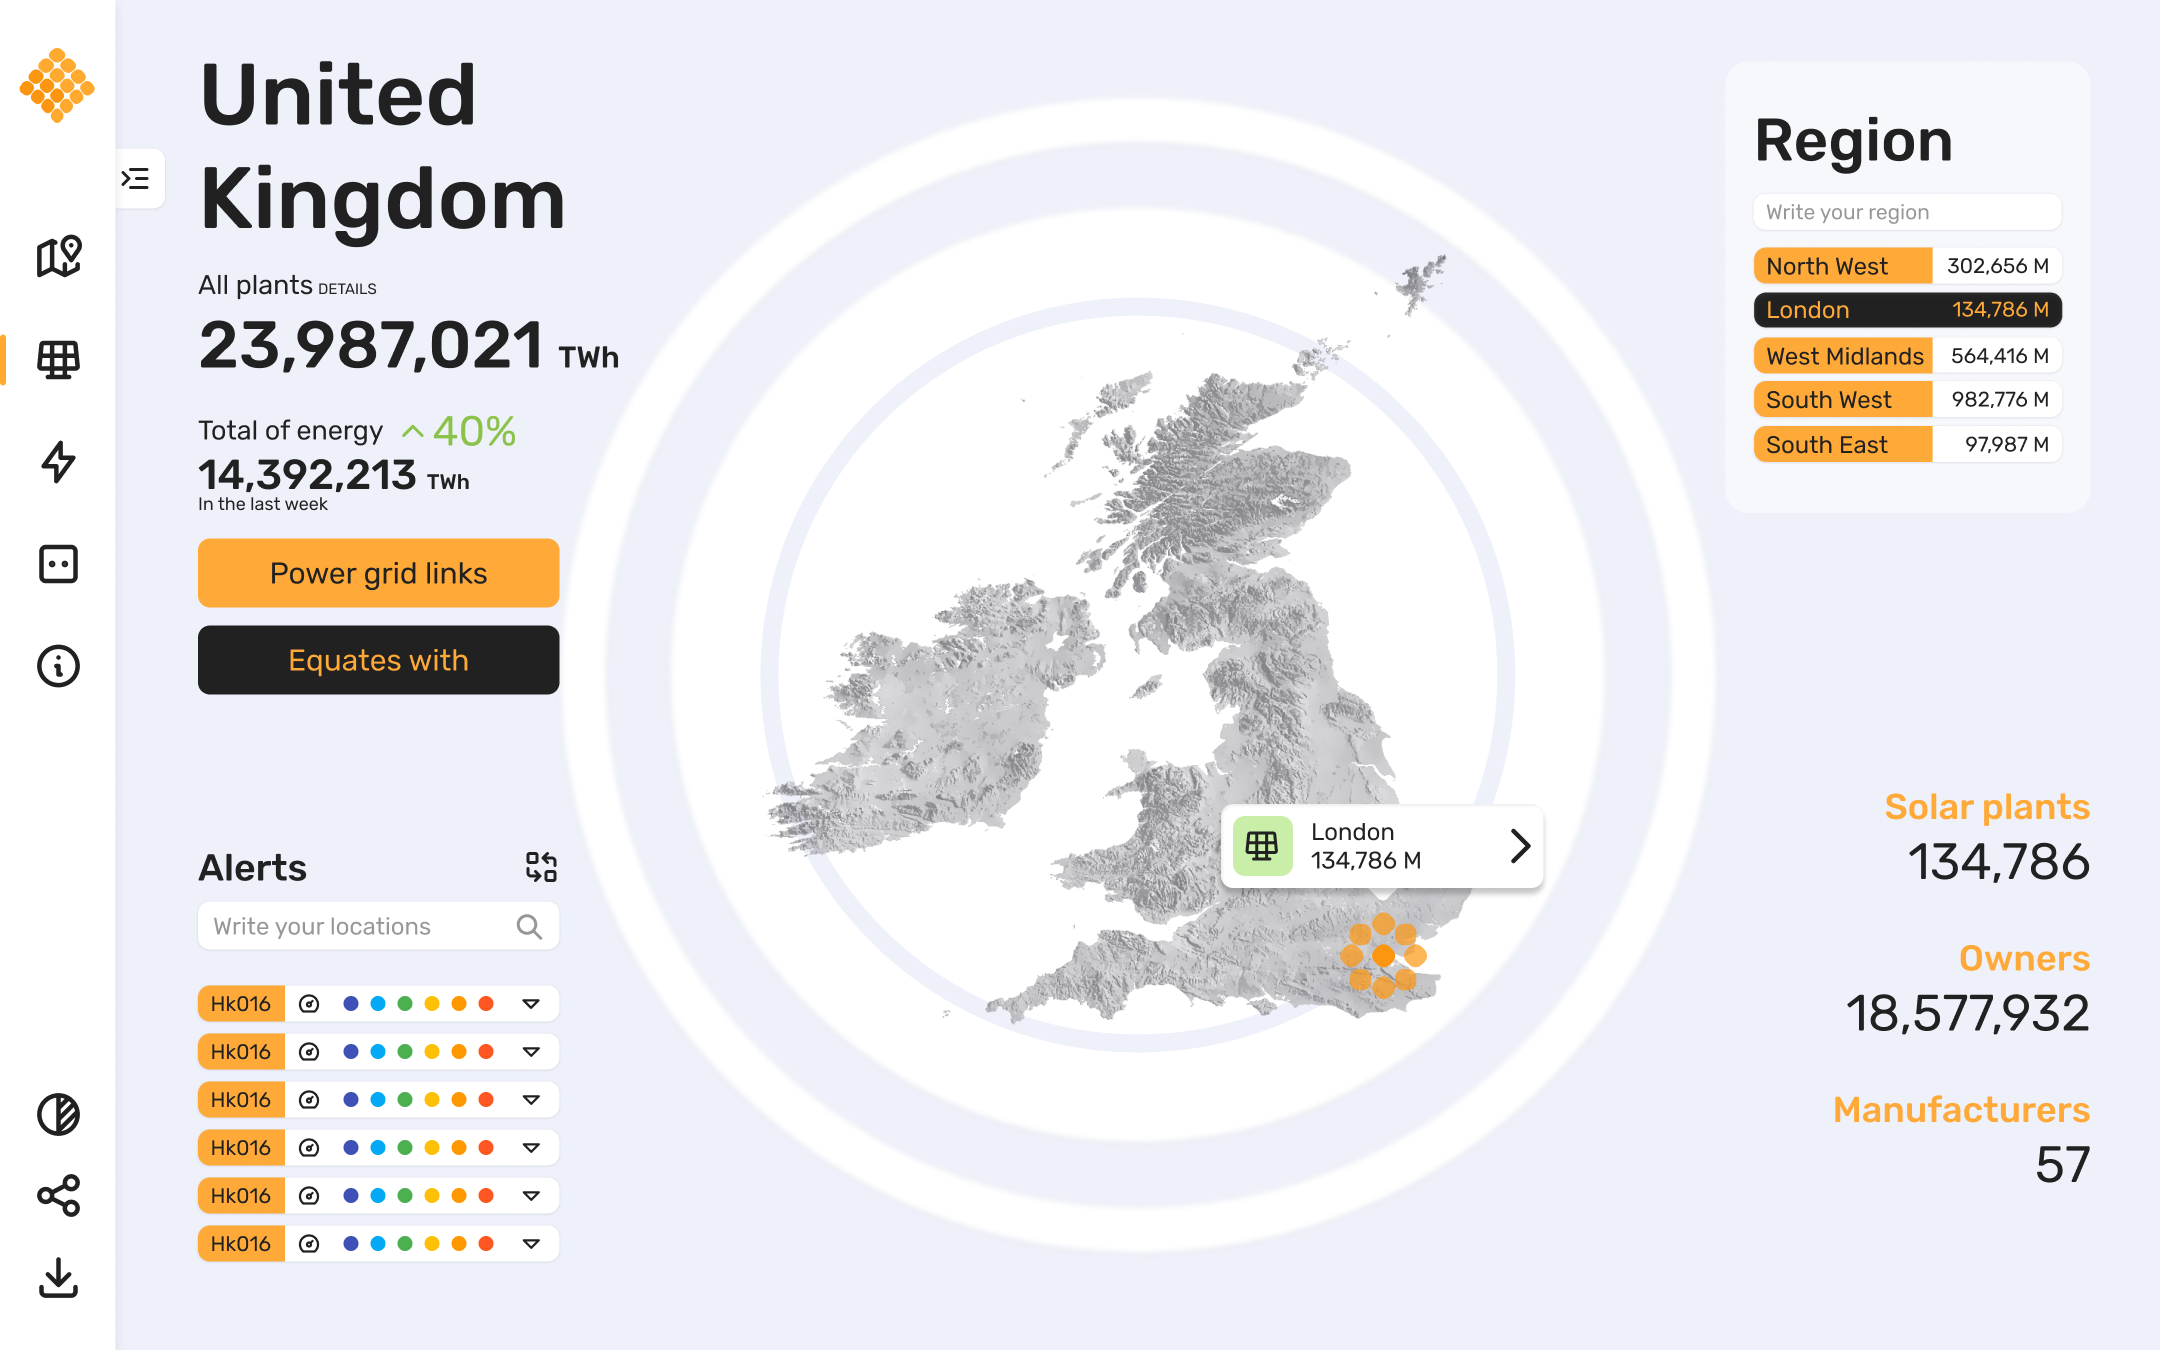
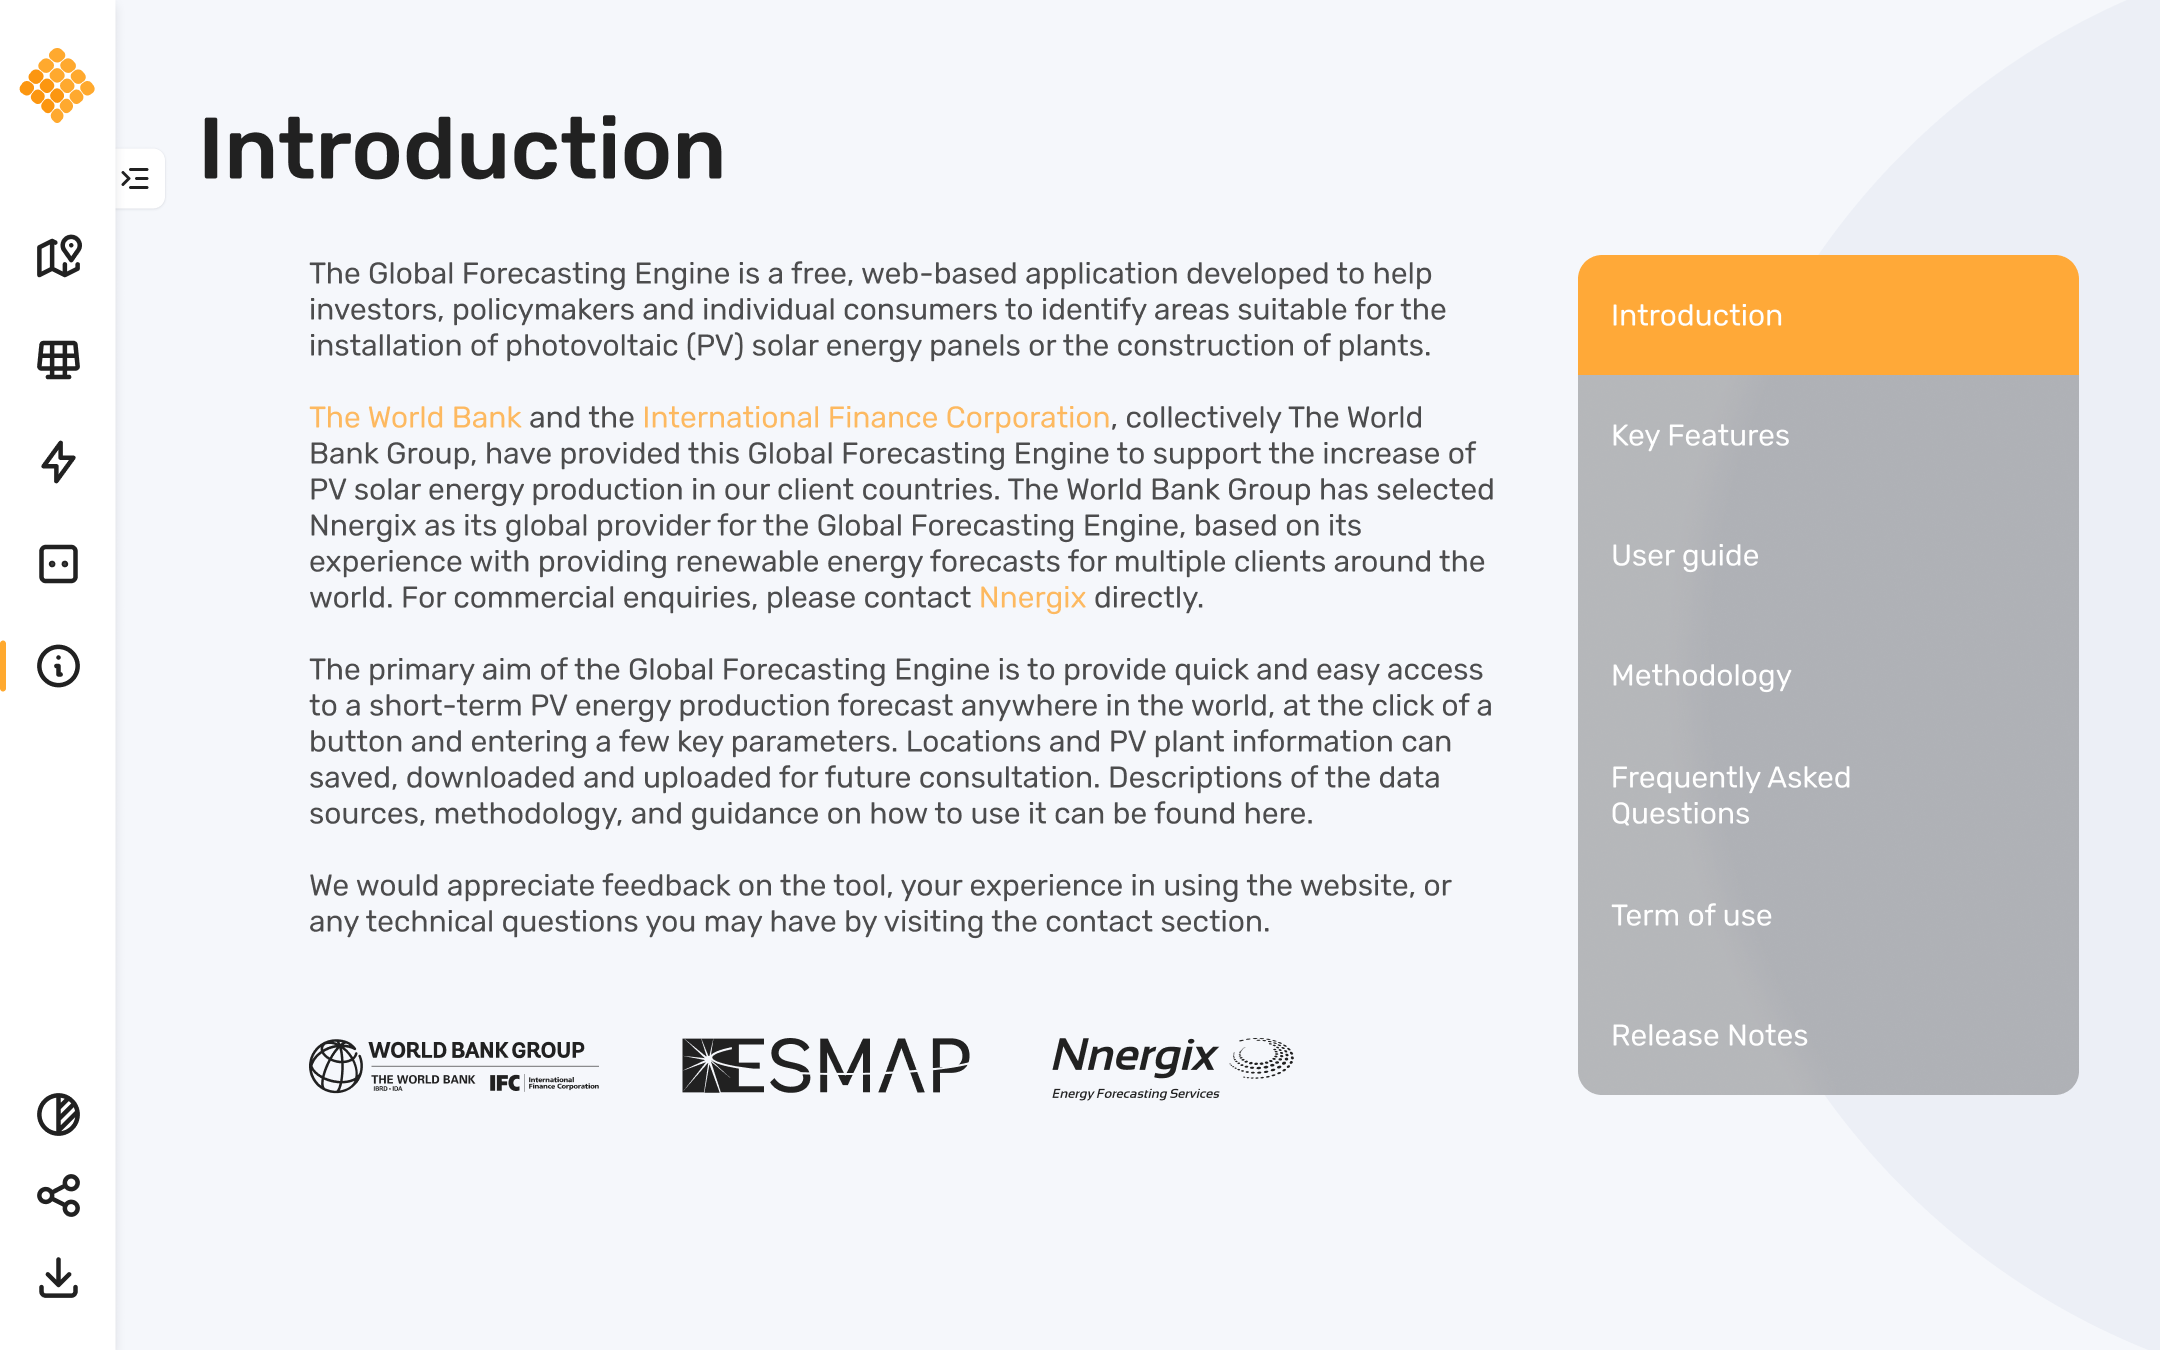
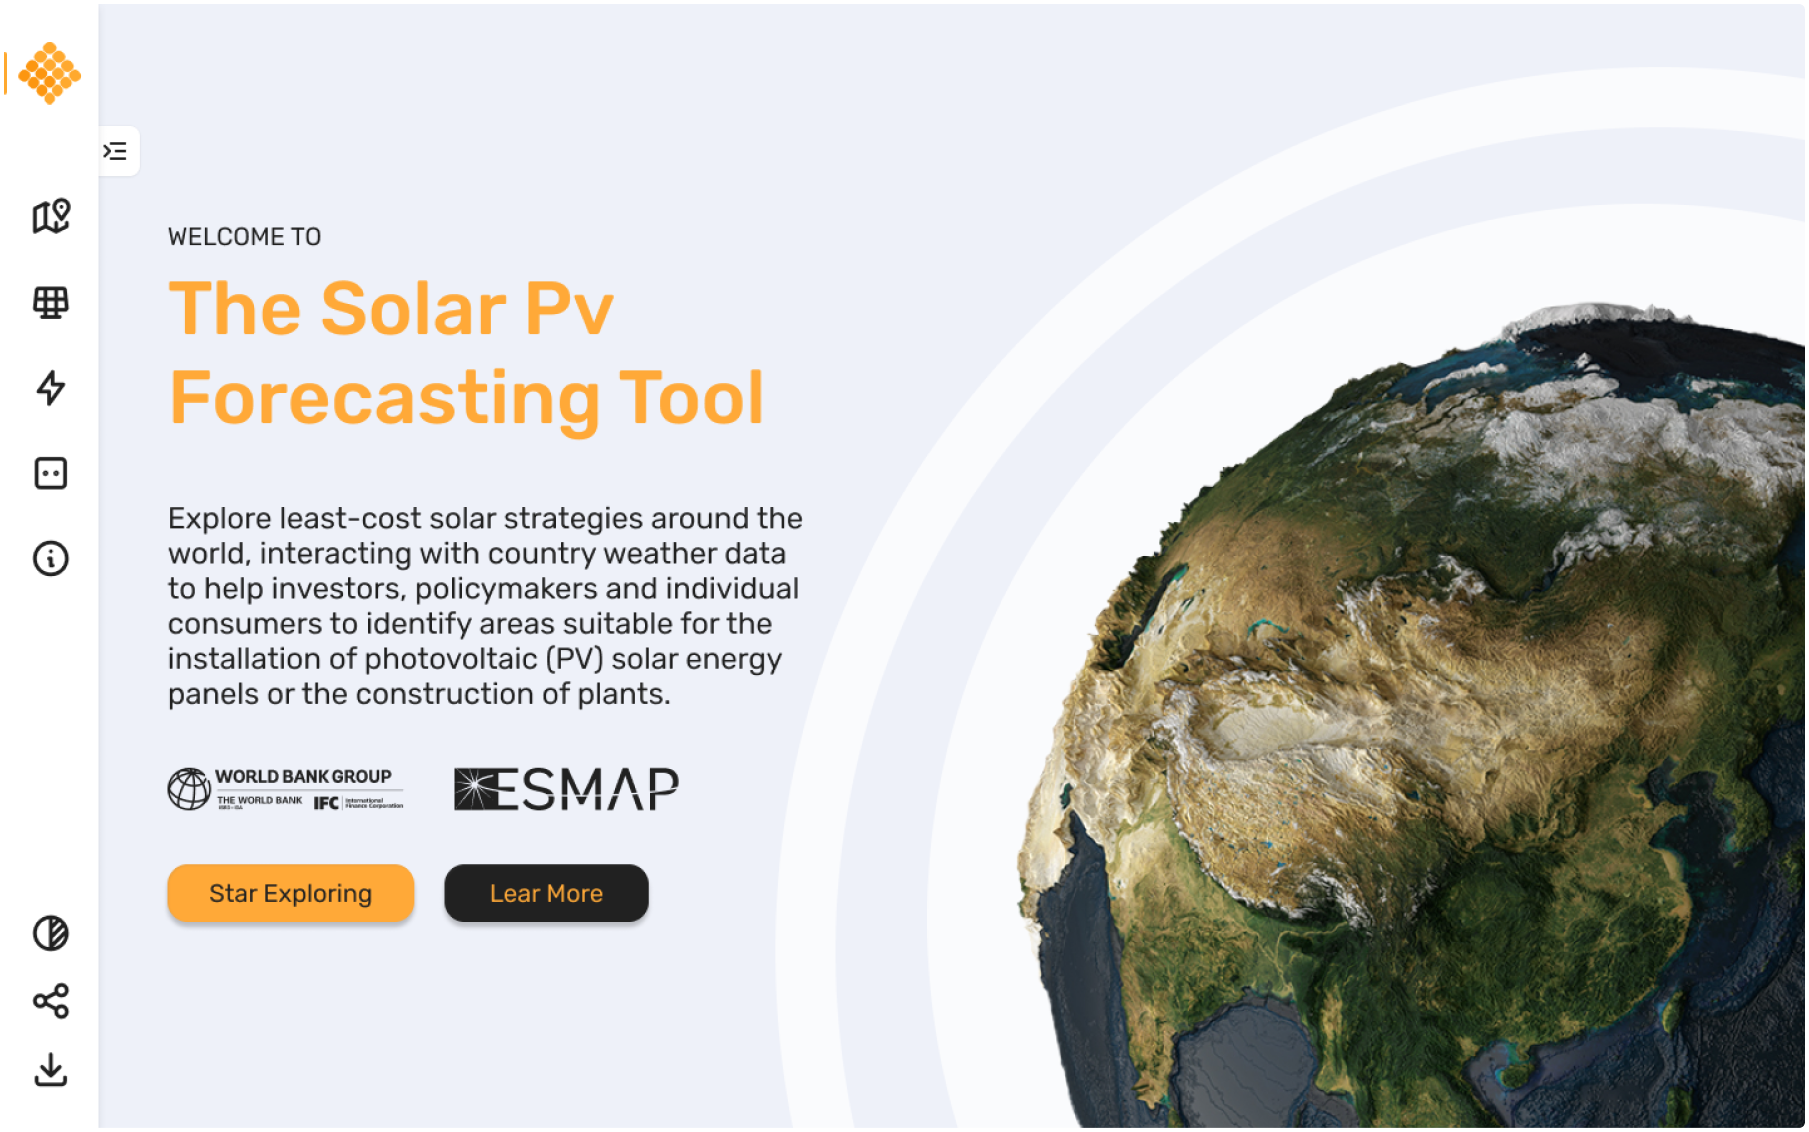
SPV is the global forecasting engine, based on cloud technology and aimed at helping investors, policy makers and individual consumers to identify suitable areas for the installation of solar photovoltaic (PV) panels or the construction of plants.

Task

For the second stage, we propose improving the interface of the application in order to upgrade the user flows.
  • Strategy

    Brand, UX Strategy

  • Design

    UI Design

  • Client

    Nnergix

Challenge

How can we monitor and know the solar energy data and help the third world?

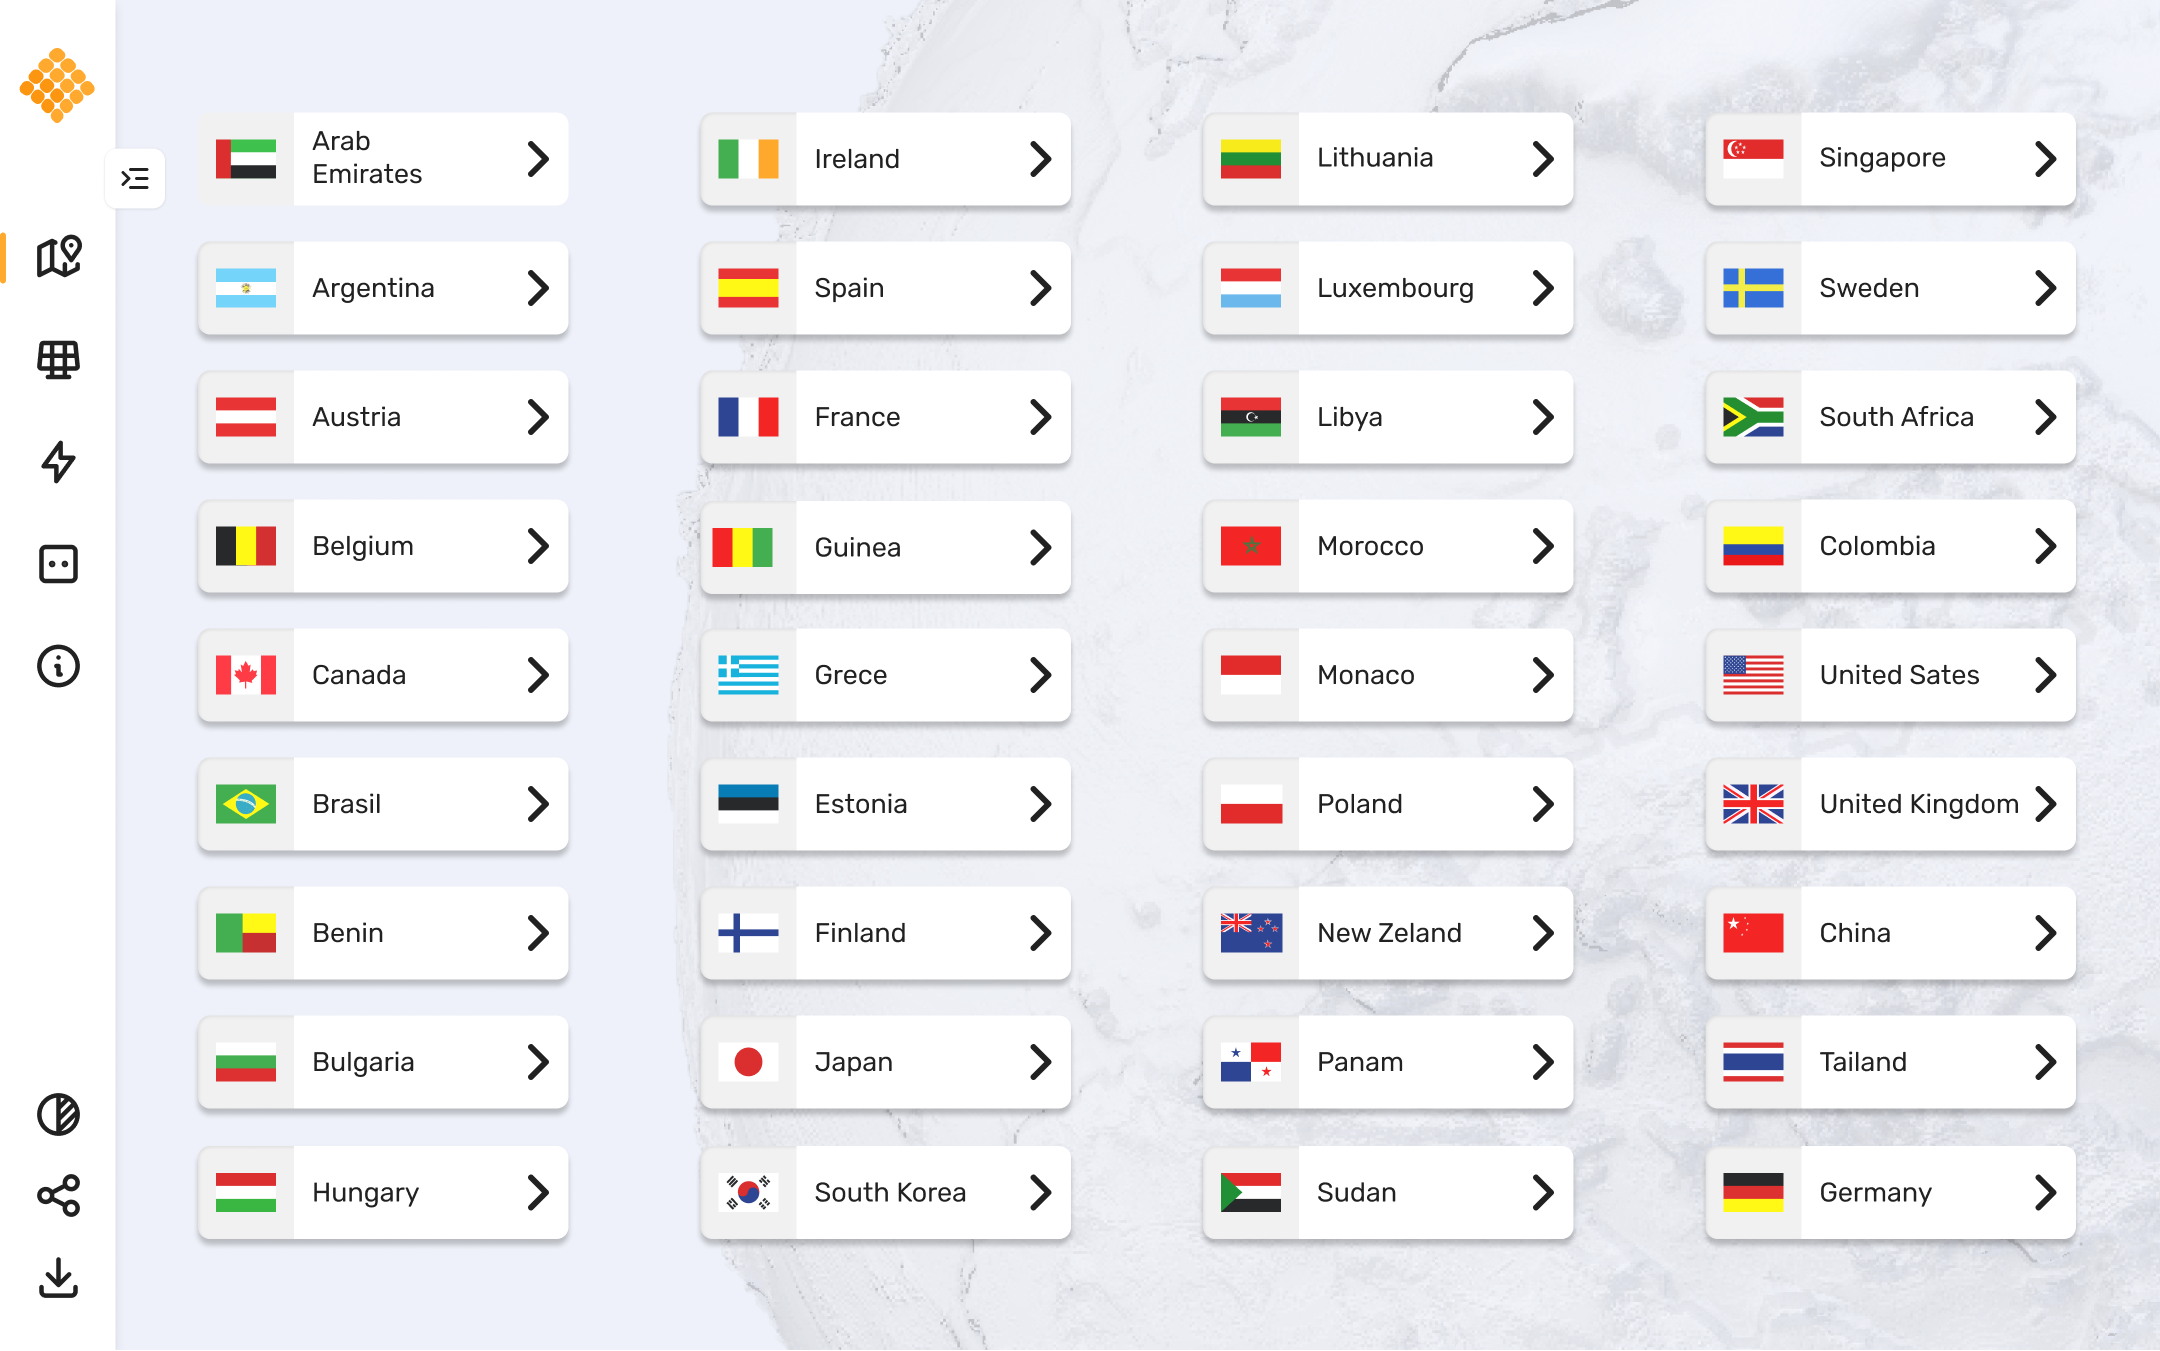
SPV is a platform that provides quick and easy access to a short-term PV power production forecast anywhere in the world, at the touch of a button and by entering a few key parameters. PV plant locations and information can be saved, downloaded and uploaded for future reference.

In researching various platforms, we found that most of them offer similar user interface and user experience solutions, but generally, the user needs good quality, state-of-the-art devices, bypassing potential countries that could use the software and adapt our energy model or capture any other time-based information, so the software must adapt to all devices on the market; mainly low-cost and older versions.

Check the version in this link, SVP

UI Goals

Adaptability

the software was mainly made for low-cost countries, so it must be adapted to low-end devices

Easy to use

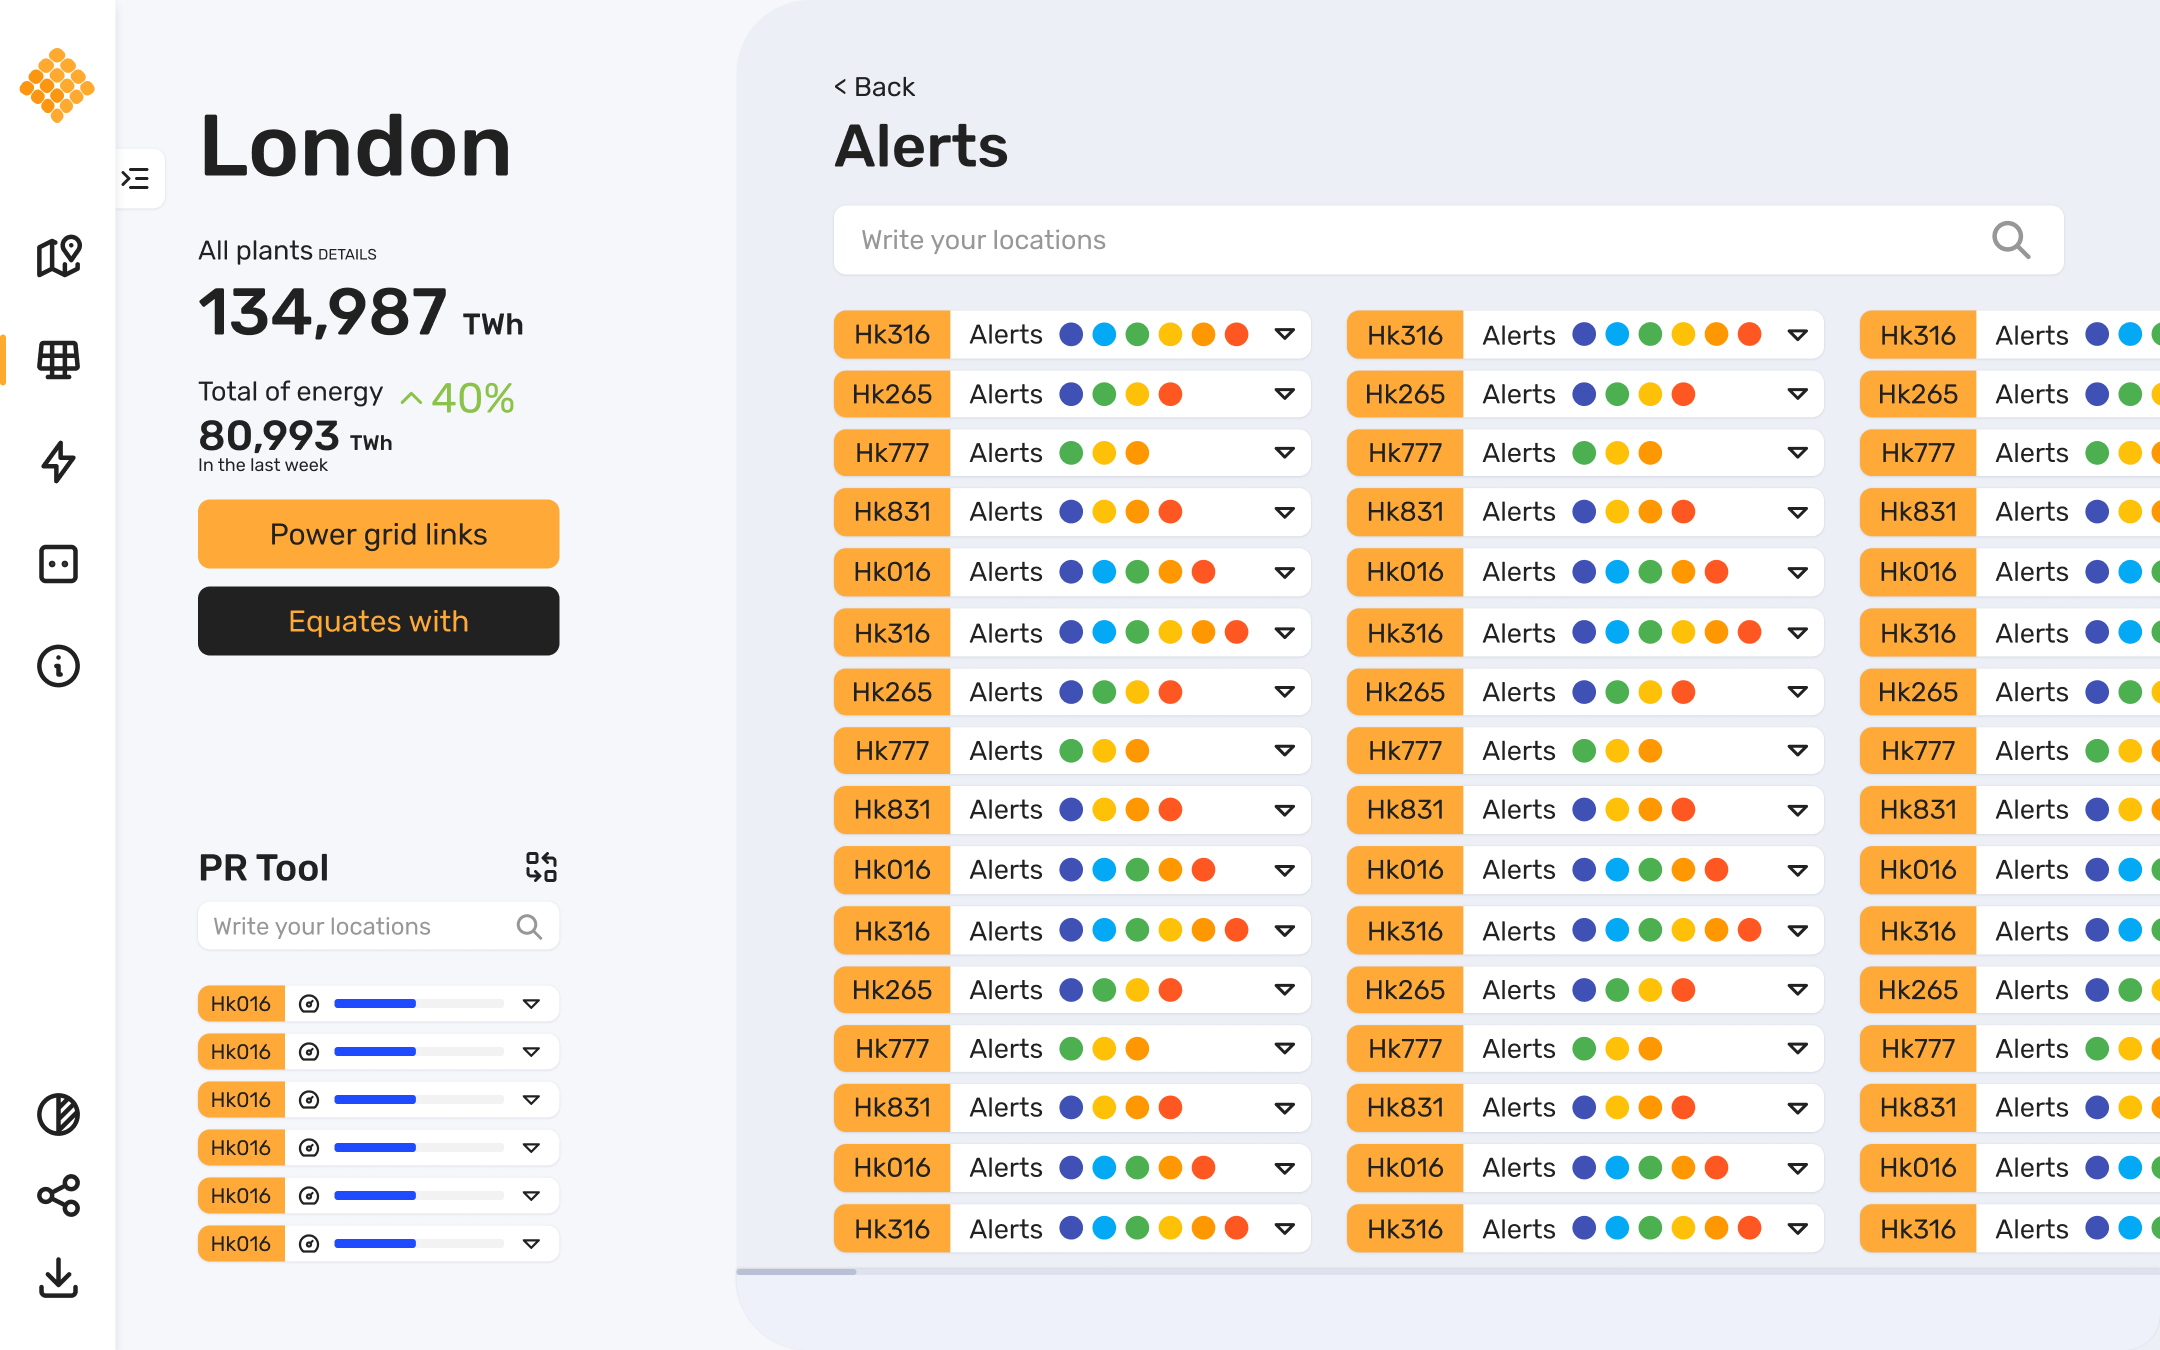
The platform must be simple for fast and effective decision support of any renewable energy platform, so everything must be understood at first sight.

Analytics board

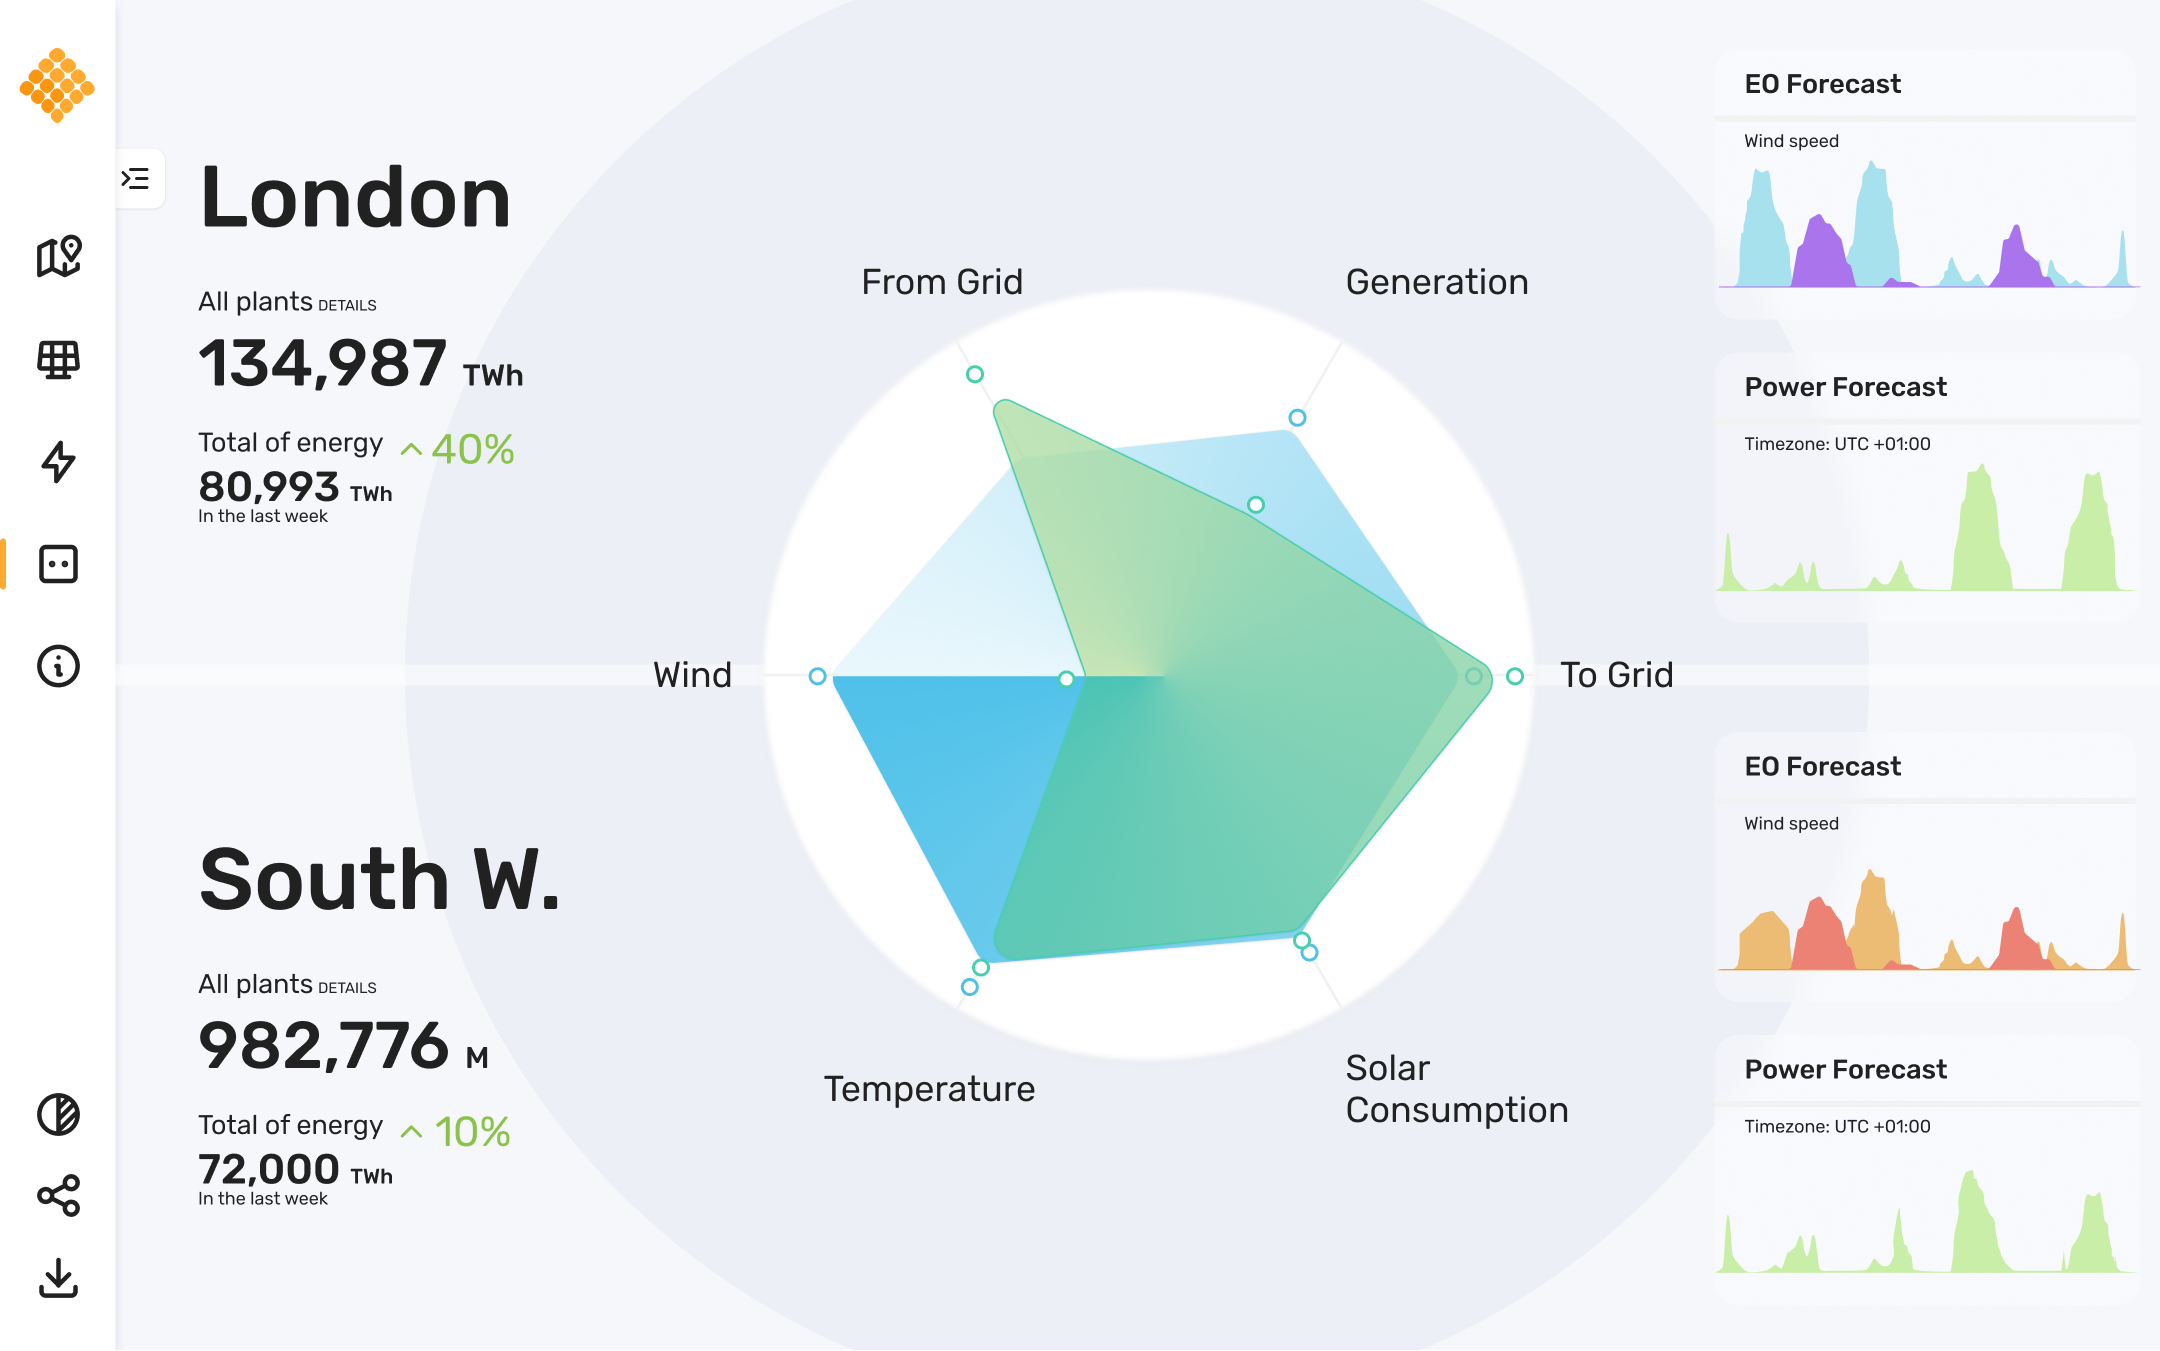
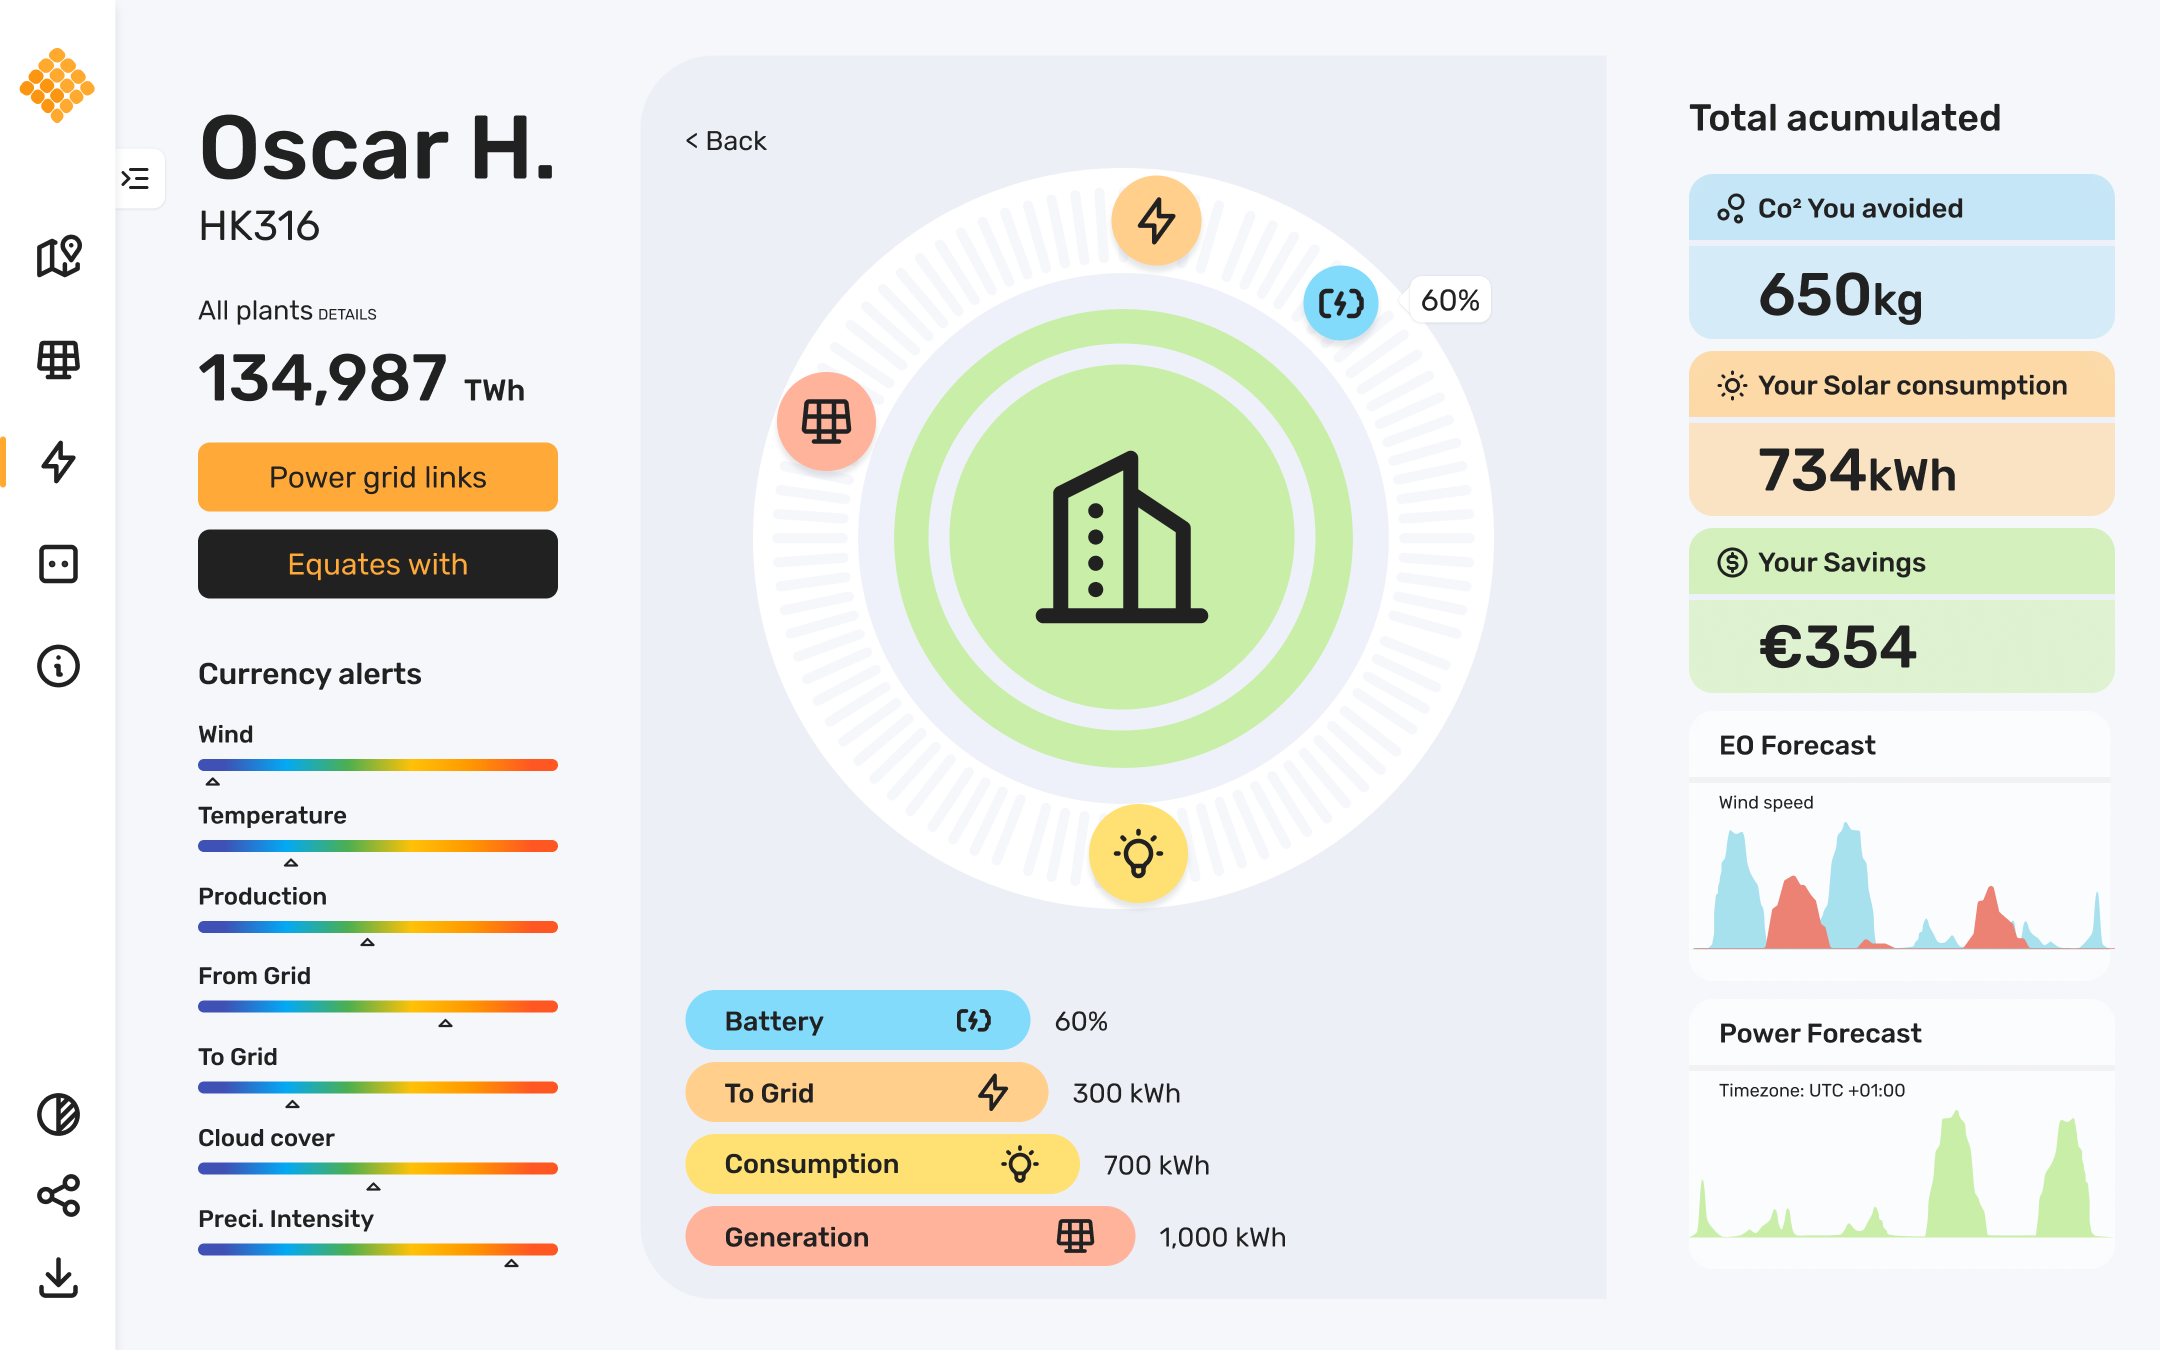
The platform manages a large amount of data, so different graphical representations of these data are required.

Customizable

The software must have the capability to adapt the interface according to the necessity of the user.

RESEARCH DATA

Site map

As a first step, we chose to update and analyze the current software architecture, in order to determine where new functionalities can be added.

Information architecture is an important step of the user-centered process, as they ensure content is in places users would expect to find it. Therefore, the process to define taxonomy is through group and map all related content also we can use as a reference point for wireframes and design a specific function.

Create

Design System
Language

Visual design aims to shape and improve the user experience through considering the effects of illustrations, photography, typography, layouts and colour on the interfaces that give better usability of products and on their aesthetic appeal.

Color Palette

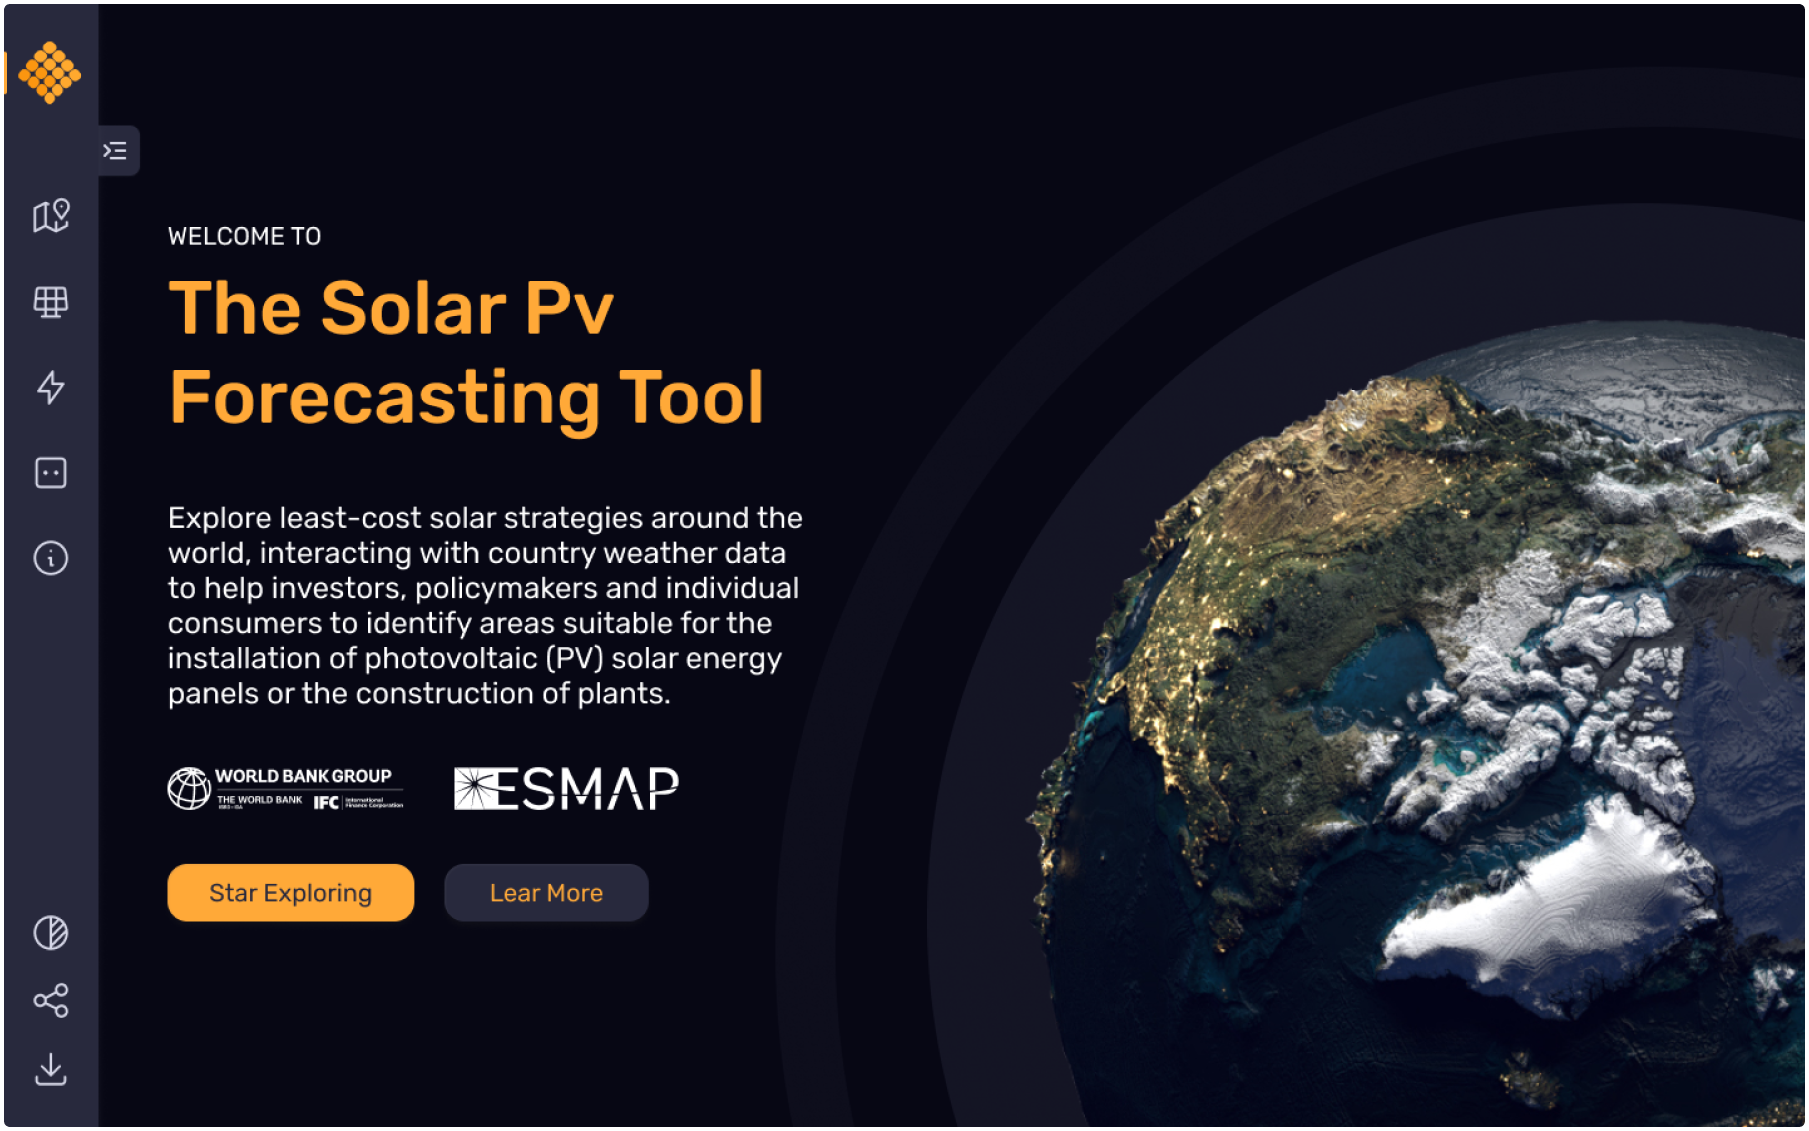
Orange is bright, positive and playful who remember the colour front of the sun and at the same time you have the dark mode where the colour is interleaved in position.

Iconography

Icons should be used to communicate or enhance an action. They should be designed and used purposefully with the goal of helping. For this project, we have chosen to use the “Feather Icons” library for its outlined style.

Typography

SVP’s typography seeks adaptability and accessibility of the software to any platform, so we chose the Rubik family throughout the content of the application, generating contrast through bold to emphasize.

Before After
Let’s Collaborate

Send us an email, to discuss a new project.

Back

We use cookies to give you the best experience. Cookie Policy